Coding using the API
This section contains a series of examples on how to use the PFANT Fortran executables from a Python script. These “bindings” to the Fortran binaries, together with the ability to load, manipulate and save PFANT data files allow for complex batch operations.
Spectral synthesis
The following code generates Figure 1.
"""Runs synthesis over short wavelength range, then plots normalized and convolved spectrum"""

import pyfant
import f311
import matplotlib.pyplot as plt


if __name__ == "__main__":
    # Copies files main.dat and abonds.dat to local directory (for given star)
    pyfant.copy_star(starname="sun-grevesse-1996")
    # Creates symbolic links to all non-star-specific files, such as atomic & molecular lines,
    # partition functions, etc.
    pyfant.link_to_data()

    # # First run
    # Creates object that will run the four Fortran executables (innewmarcs, hydro2, pfant, nulbad)
    obj = pyfant.Combo()
    # synthesis interval start (angstrom)
    obj.conf.opt.llzero = 6530
    # synthesis interval end (angstrom)
    obj.conf.opt.llfin = 6535

    # Runs Fortrans and hangs until done
    obj.run()

    # Loads result files into memory. obj.result is a dictionary containing elements ...
    obj.load_result()
    print("obj.result = {}".format(obj.result))
    res = obj.result
    plt.figure()
    f311.draw_spectra_overlapped([res["norm"], res["convolved"]])
    plt.savefig("norm-convolved.png")
    plt.show()
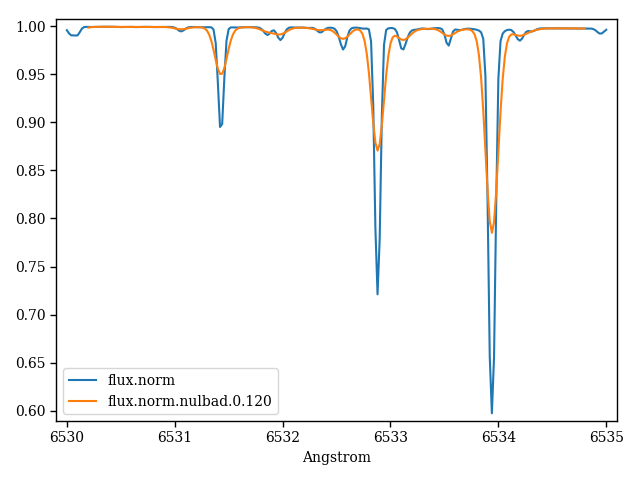
Figure 1 – pfant (file “flux.norm”) and nulbad outputs.
Spectral synthesis - convolutions
The following example convolves the synthetic spectrum (file “flux.norm”) with Gaussian profiles of different FWHMs (Figure 2).
#!/usr/bin/env python

"""Runs synthesis over short wavelength range, then plots normalized and convolved spectrum"""

import pyfant
import matplotlib.pyplot as plt
import a99
import f311

# FWHM (full width at half of maximum) of Gaussian profiles in angstrom
FWHMS = [0.03, 0.06, 0.09, 0.12, 0.15, 0.20, 0.25, 0.3, 0.5]

if __name__ == "__main__":
    # Copies files main.dat and abonds.dat to local directory (for given star)
    pyfant.copy_star(starname="sun-grevesse-1996")
    # Creates symbolic links to all non-star-specific files
    pyfant.link_to_data()

    # # 1) Spectral synthesis
    # Creates object that will run the four Fortran executables (innewmarcs, hydro2, pfant, nulbad)
    ecombo = pyfant.Combo()
    # synthesis interval start (angstrom)
    ecombo.conf.opt.llzero = 6530
    # synthesis interval end (angstrom)
    ecombo.conf.opt.llfin = 6535
    # Runs Fortrans and hangs until done
    ecombo.run()
    ecombo.load_result()
    # Retains un-convolved spectrum for comparison
    spectra = [ecombo.result["norm"]]

    # # 2) Convolutions
    for fwhm in FWHMS:
        enulbad = pyfant.Nulbad()
        enulbad.conf.opt.fwhm = fwhm
        enulbad.run()
        enulbad.load_result()
        # Appends convolved spectrum for comparison
        spectra.append(enulbad.result["convolved"])

    # # 3) Plots
    plt.figure()
    f311.draw_spectra_overlapped(spectra)
    K = 1.1
    a99.set_figure_size(plt.gcf(), 1000*K, 500*K)
    plt.tight_layout()
    plt.savefig("many-convs.png")
    plt.show()
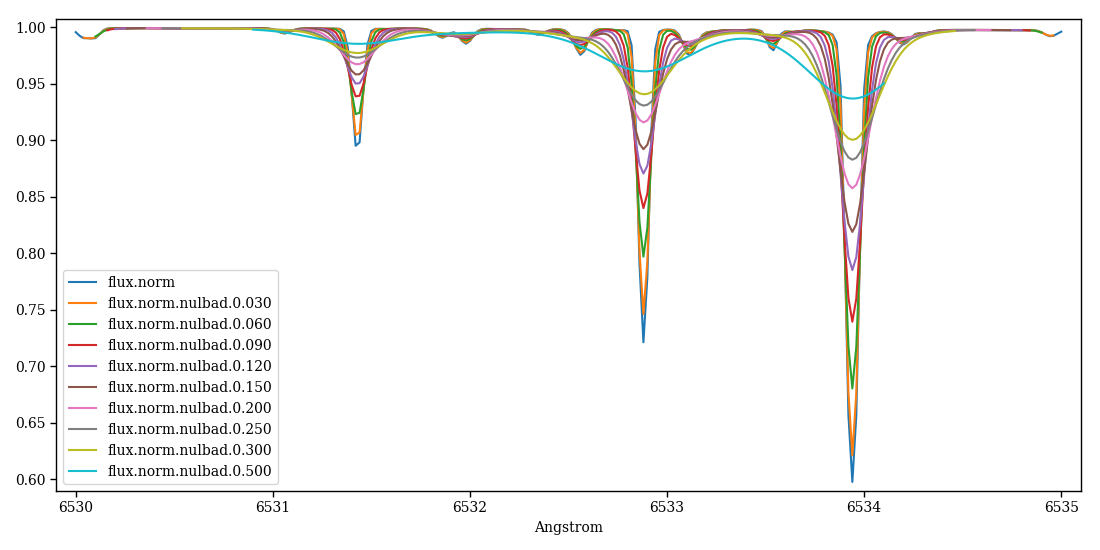
Figure 2 – single pfant output and several nulbad outputs.
Spectral synthesis - Continuum
The following code generates Figure 3.
"""Runs synthesis over large wavelength range, then plots continuum"""

import pyfant
import f311
import matplotlib.pyplot as plt
import a99

if __name__ == "__main__":
    # Copies files main.dat and abonds.dat to local directory (for given star)
    pyfant.copy_star(starname="sun-grevesse-1996")
    # Creates symbolic links to all non-star-specific files, such as atomic & molecular lines,
    # partition functions, etc.
    pyfant.link_to_data()

    # Creates object that will run the four Fortran executables (innewmarcs, hydro2, pfant, nulbad)
    obj = pyfant.Combo()
    oo = obj.conf.opt
    # synthesis interval start (angstrom)
    oo.llzero = 2500
    # synthesis interval end (angstrom)
    oo.llfin = 30000
    # savelength step (angstrom)
    oo.pas = 1.
    # Turns off hydrogen lines
    oo.no_h = True
    # Turns off atomic lines
    oo.no_atoms = True
    # Turns off molecular lines
    oo.no_molecules = True

    obj.run()
    obj.load_result()
    print("obj.result = {}".format(obj.result))
    res = obj.result
    f311.draw_spectra_stacked([res["cont"]], setup=f311.PlotSpectrumSetup(fmt_ylabel=None))
    K = .75
    a99.set_figure_size(plt.gcf(), 1300*K, 450*K)
    plt.tight_layout()
    plt.savefig("continuum.png")
    plt.show()
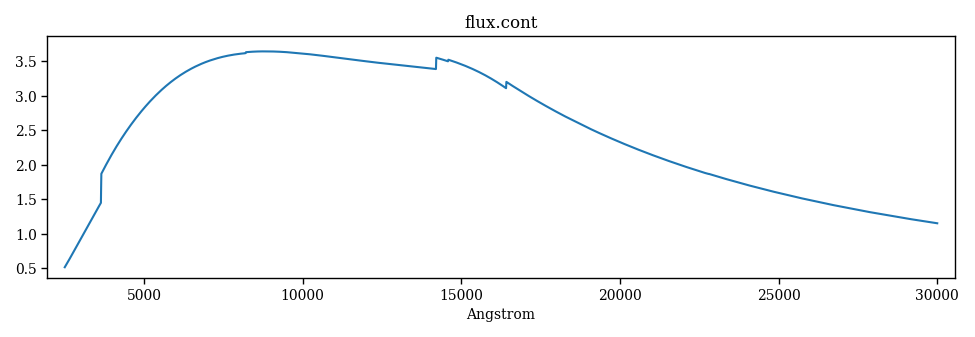
Figure 3 – continuum.
Spectral synthesis - Separate atomic species
PFANT atomic lines files contains wavelength, log_gf and other tabulated information for several (element, ionization level) atomic species.
The following code calculates isolated atomic spectra for a list of arbitrarily chosen atomic species (Figure 4).
"""Runs synthesis for specified atomic species separately. No molecules or hydrogen lines."""

import pyfant
import f311
import matplotlib.pyplot as plt
import a99

# ["<element name><ionization level>", ...] for which to draw panels
MY_SPECIES = ["Fe1", "Fe2", "Ca1", "Ca2", "Na1", "Si1"]

if __name__ == "__main__":
    pyfant.copy_star(starname="sun-grevesse-1996")
    pyfant.link_to_data()

    # Loads full atomic lines file
    fatoms = pyfant.FileAtoms()
    fatoms.load()

    runnables = []
    for elem_ioni in MY_SPECIES:
        atom = fatoms.find_atom(elem_ioni)

        # Creates atomic lines file object containing only one atom
        fatoms2 = pyfant.FileAtoms()
        fatoms2.atoms = [atom]

        ecombo = pyfant.Combo()
        # Overrides file "atoms.dat" with in-memory object
        ecombo.conf.file_atoms = fatoms2
        ecombo.conf.flag_output_to_dir = True
        oo = ecombo.conf.opt
        # Assigns synthesis range to match atomic lines range
        oo.llzero, oo.llfin = fatoms2.llzero, fatoms2.llfin
        # Turns off hydrogen lines
        oo.no_h = True
        # Turns off molecular lines
        oo.no_molecules = True

        runnables.append(ecombo)

    pyfant.run_parallel(runnables)

    # Draws figure
    f = plt.figure()
    a99.format_BLB()
    for i, (title, ecombo) in enumerate(zip(MY_SPECIES, runnables)):
        ecombo.load_result()
        plt.subplot(2, 3, i+1)
        f311.draw_spectra_overlapped([ecombo.result["spec"]],
                                   setup=f311.PlotSpectrumSetup(flag_xlabel=i/3 >= 1, flag_legend=False))
        plt.title(title)

    K = 1.
    a99.set_figure_size(plt.gcf(), 1300*K, 740*K)
    plt.tight_layout()
    plt.savefig("synthesis-atoms.png")
    plt.show()
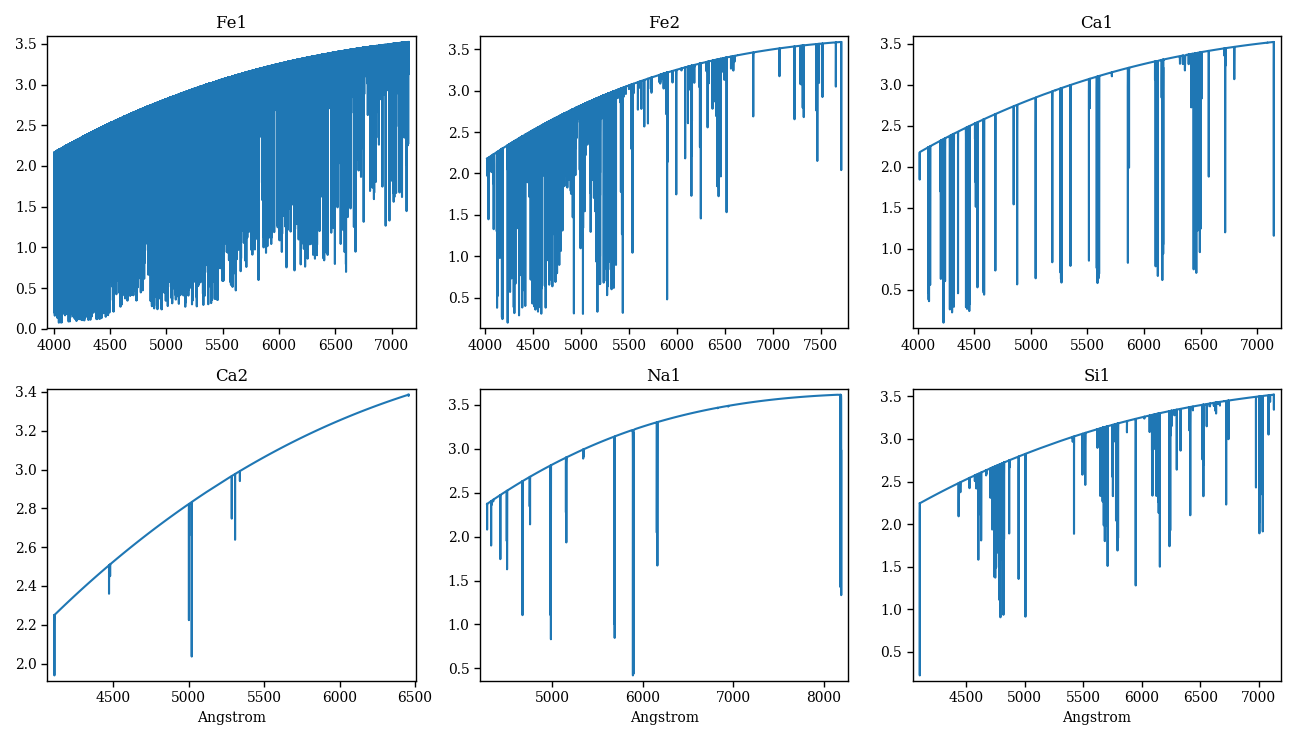
Figure 4 – atomic lines synthesized separately for each species.
Spectral synthesis - Separate molecules
The following code generates Figure 5, Figure 6, and additional plots not shown here.
"""Runs synthesis for molecular species separately. No atomic nor hydrogen lines."""

import matplotlib.pyplot as plt
import a99
import pyfant
import f311

SUBPLOT_NUM_ROWS = 2
SUBPLOT_NUM_COLS = 2

if __name__ == "__main__":
    pyfant.copy_star(starname="sun-grevesse-1996")
    pyfant.link_to_data()

    # Loads full molecular lines file
    fmol = pyfant.FileMolecules()
    fmol.load()


    runnables = []
    for molecule in fmol:
        fmol2 = pyfant.FileMolecules()
        fmol2.molecules = [molecule]

        ecombo = pyfant.Combo()
        # Overrides file "molecules.dat" with in-memory object
        ecombo.conf.file_molecules = fmol2
        ecombo.conf.flag_output_to_dir = True
        oo = ecombo.conf.opt
        # Assigns synthesis range to match atomic lines range
        oo.llzero, oo.llfin = fmol2.llzero, fmol2.llfin
        # Turns off hydrogen lines
        oo.no_h = True
        # Turns off atomic lines
        oo.no_atoms = True
        # Adjusts the wavelength step according to the calculation interval
        oo.pas = max(1, round(oo.llfin*1./20000/2.5)*2.5)
        oo.aint = max(50., oo.pas)

        runnables.append(ecombo)

    pyfant.run_parallel(runnables)

    num_panels = SUBPLOT_NUM_COLS*SUBPLOT_NUM_ROWS
    num_molecules = len(runnables)
    ifigure = 0
    a99.format_BLB()
    for i in range(num_molecules+1):
        not_first = i > 0
        first_panel_of_figure = (i / num_panels - int(i / num_panels)) < 0.01
        is_panel = i < num_molecules

        if not_first and (not is_panel or first_panel_of_figure):
            plt.tight_layout()
            K = 1.
            a99.set_figure_size(plt.gcf(), 1500 * K, 740 * K)
            plt.tight_layout()
            filename_fig ="synthesis-molecules-{}.png".format(ifigure)
            print("Saving figure '{}'...".format(filename_fig))
            plt.savefig(filename_fig)
            plt.close()
            ifigure += 1

        if first_panel_of_figure and is_panel:
            plt.figure()

        if is_panel:
            ecombo = runnables[i]
            ecombo.load_result()

            isubplot = i % num_panels + 1
            plt.subplot(SUBPLOT_NUM_ROWS, SUBPLOT_NUM_COLS, isubplot)
            f311.draw_spectra_overlapped([ecombo.result["spec"]],
               setup=f311.PlotSpectrumSetup(flag_xlabel=i/3 >= 1, flag_legend=False))

            _title = fmol[i].description
            if "]" in _title:
                title = _title[:_title.index("]")+1]
            else:
                title = _title[:20]
            plt.title(title)
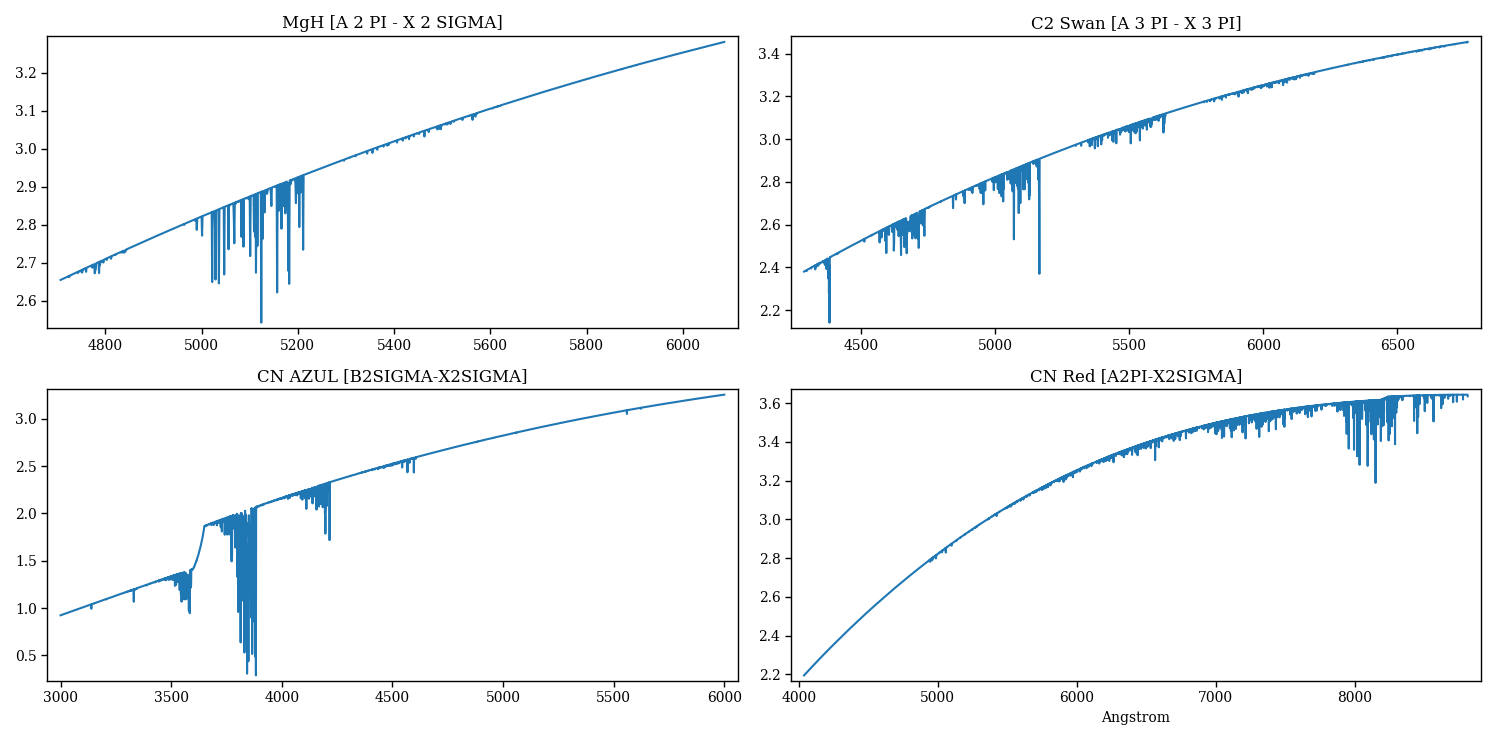
Figure 5 – molecular lines synthesized separately for each species
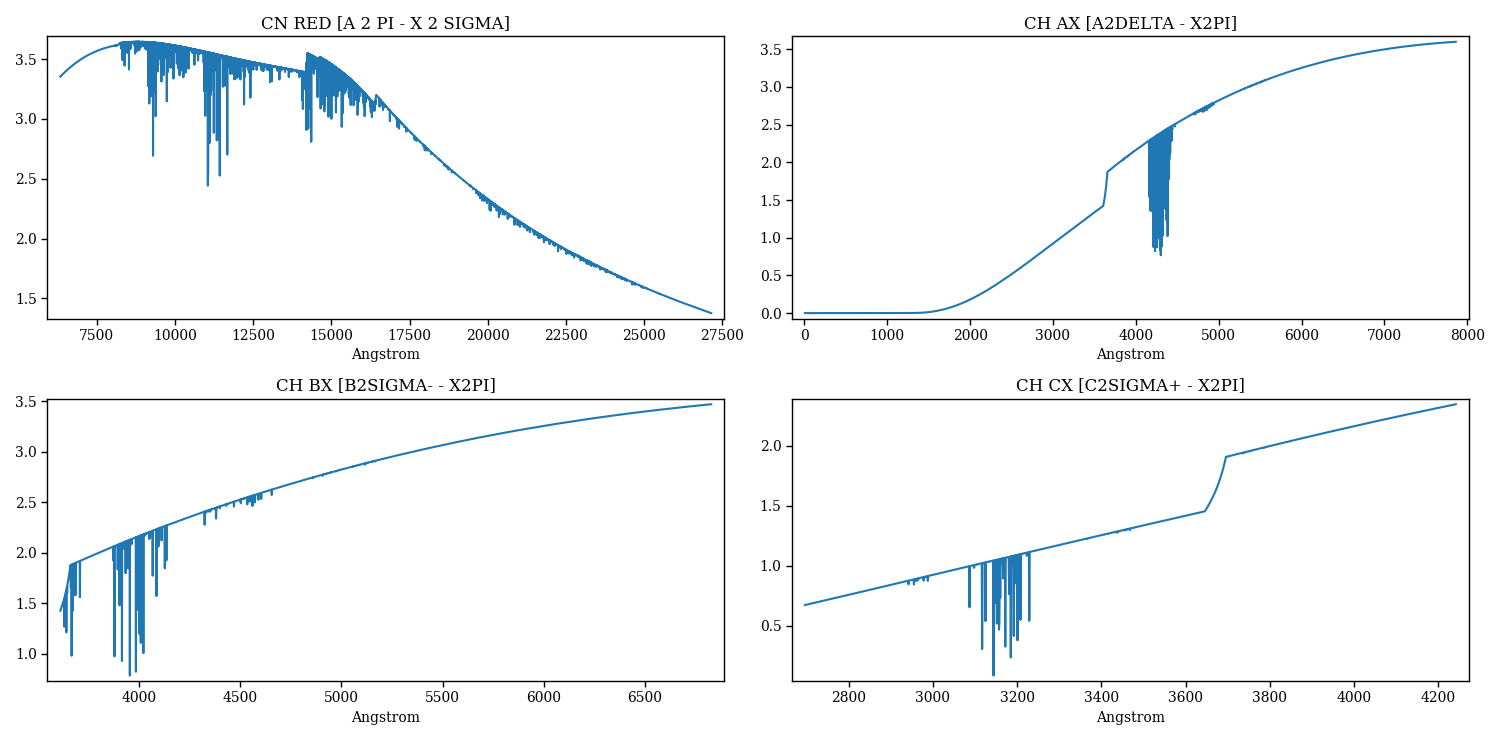
Figure 6 – molecular lines synthesized separately for each species.
Gaussian profiles as nulbad outputs
nulbad is one of the Fortran executables of the PFANT package. It is the one that convolves
the synthetic spectrum calculated by pfant with a Gaussian profile specified by a “fwhm”
parameter (Figure 7).
"""
Nulbad's "impulse response"

Saves "impulse" spectrum (just a spike at lambda=5000 angstrom) as "flux.norm",
then runs `nulbad` repeatedly to get a range of Gaussian profiles.

"""

import pyfant
import f311
import matplotlib.pyplot as plt
import a99
import numpy as np


# FWHM (full width at half of maximum) of Gaussian profiles in angstrom
FWHMS = [0.03, 0.06, 0.09, 0.12, 0.15, 0.20, 0.25, 0.3]

if __name__ == "__main__":
    # Copies files main.dat and abonds.dat to local directory (for given star)
    pyfant.copy_star(starname="sun-grevesse-1996")
    # Creates symbolic links to all non-star-specific files
    pyfant.link_to_data()

    # # 1) Creates "impulse" spectrum
    fsp = pyfant.FileSpectrumPfant()
    sp = f311.Spectrum()
    N = 2001
    sp.x = (np.arange(0, N, dtype=float)-(N-1)/2)*0.001+5000
    sp.y = np.zeros((N,), dtype=float)
    sp.y[int((N-1)/2)] = 1.

    fsp.spectrum = sp
    fsp.save_as("flux.norm")

    # # 2) Convolutions
    spectra = []
    for fwhm in FWHMS:
        enulbad = pyfant.Nulbad()
        enulbad.conf.opt.fwhm = fwhm
        enulbad.run()
        enulbad.load_result()
        enulbad.clean()
        # Appends convolved spectrum for comparison
        spectra.append(enulbad.result["convolved"])

    # # 3) Plots
    f = plt.figure()
    f311.draw_spectra_overlapped(spectra)
    K = 0.7
    a99.set_figure_size(plt.gcf(), 1300*K, 500*K)
    plt.tight_layout()
    plt.savefig("gaussian-profiles.png")
    plt.show()
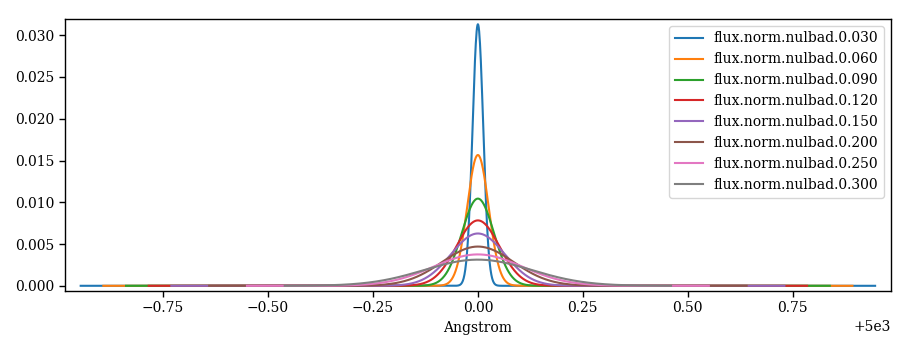
Figure 7 – Gaussian profiles illustrated for different FWHMs.
Plot hydrogen profiles
The following code generates Figure 8.
"""
Calculates hydrogen lines profiles, then plots them in several 3D subplots
"""

import pyfant
import a99
import os
import shutil
import matplotlib.pyplot as plt
from mpl_toolkits.mplot3d import Axes3D  # yes, required (see below)

def mylog(*args):
    print("^^ {}".format(", ".join(args)))


def main(flag_cleanup=True):
    tmpdir = a99.new_filename("hydrogen-profiles")

    # Saves current directory
    pwd = os.getcwd()
    mylog("Creating directory '{}'...".format(tmpdir))
    os.mkdir(tmpdir)
    try:
        pyfant.link_to_data()
        _main()
    finally:
        # Restores current directory
        os.chdir(pwd)
        # Removes temporary directory
        if flag_cleanup:
            mylog("Removing directory '{}'...".format(tmpdir))
            shutil.rmtree(tmpdir)
        else:
            mylog("Not cleaning up.")


def _main():
    fm = pyfant.FileMain()
    fm.init_default()
    fm.llzero, fm.llfin = 1000., 200000.  # spectral synthesis range in Angstrom

    ei = pyfant.Innewmarcs()
    ei.conf.file_main = fm
    ei.run()
    ei.clean()

    eh = pyfant.Hydro2()
    eh.conf.file_main = fm
    eh.run()
    eh.load_result()
    eh.clean()

    _plot_profiles(eh.result["profiles"])


def _plot_profiles(profiles):
    fig = plt.figure()
    i = 0
    for filename, ftoh in profiles.items():
        if ftoh is not None:
            mylog("Drawing '{}'...".format(filename))
            # ax = plt.subplot(2, 3, i+1)
            ax = fig.add_subplot(2, 3, i+1, projection='3d')
            ax.set_title(filename)
            pyfant.draw_toh(ftoh, ax)
            i += 1

    plt.tight_layout()
    plt.savefig("hydrogen-profiles.png")
    plt.show()


if __name__ == "__main__":
    main(flag_cleanup=True)
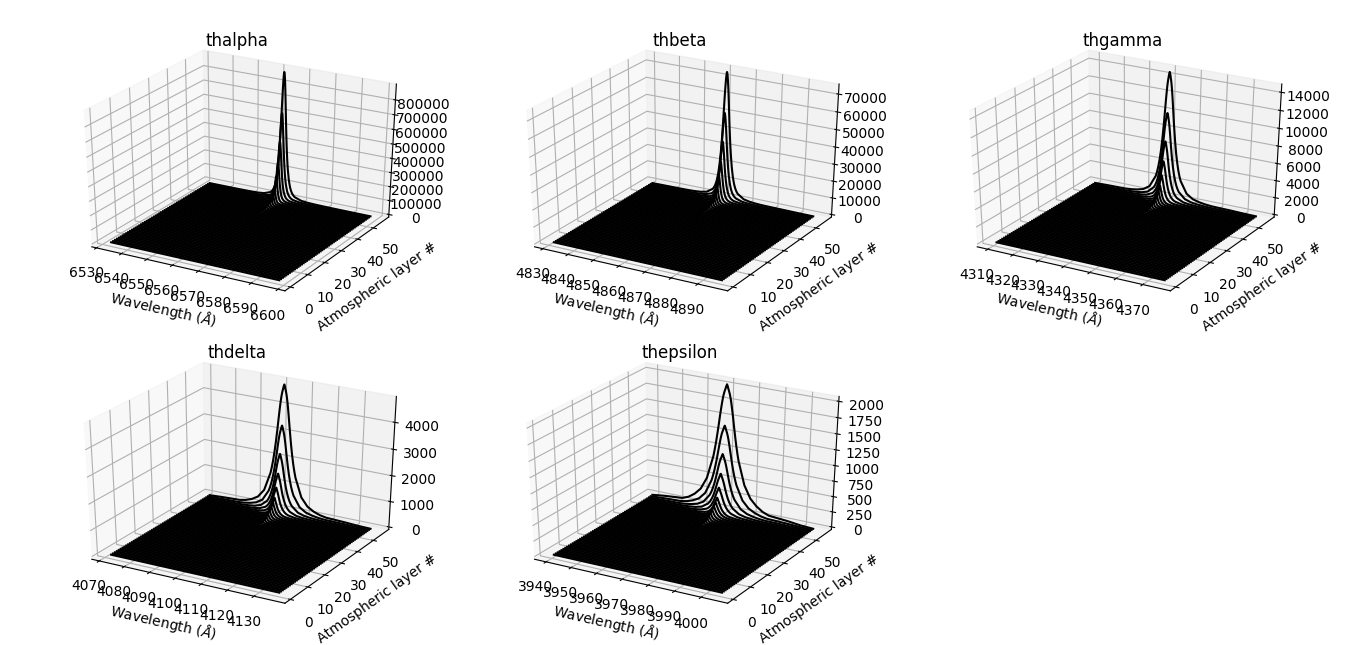
Figure 8 – hydrogen lines profiles as calculated by hydro2.
Import Kurucz’ molecular linelist file
"""
This example loads file "c2dabrookek.asc" and prints a memory representation of its first line.

This file can be obtained at http://kurucz.harvard.edu/molecules/c2/. First lines of file:

```
  287.7558-14.533 23.0  2354.082 24.0 -37095.578 6063a00e1  3d10e3  12 677  34741.495
  287.7564-14.955 22.0  2282.704 23.0 -37024.124 6063a00f1  3d10f3  12 677  34741.419
  287.7582-14.490 21.0  2214.696 22.0 -36955.900 6063a00e1  3d10e3  12 677  34741.205
  287.7613-15.004 24.0  2428.453 25.0 -37169.280 6063a00f1  3d10f3  12 677  34740.828
  287.7650-14.899 20.0  2149.765 21.0 -36890.147 6063a00f1  3d10f3  12 677  34740.382
```
"""

import f311

f = f311.load_any_file("c2dabrookek.asc")

print(repr(f[0]).replace(", ", ",\n              "))
This code should print the following:
KuruczMolLine(lambda_=2877.558,
              loggf=-14.533,
              J2l=23.0,
              E2l=2354.082,
              Jl=24.0,
              El=37095.578,
              atomn0=6,
              atomn1=6,
              state2l='a',
              v2l=0,
              lambda_doubling2l='e',
              spin2l=1,
              statel='d',
              vl=10,
              lambda_doublingl='e',
              spinl=3,
              iso=12)