Spectrometre Modes & Spectral Lines of Interest at Redshift
wavelength-chart.py

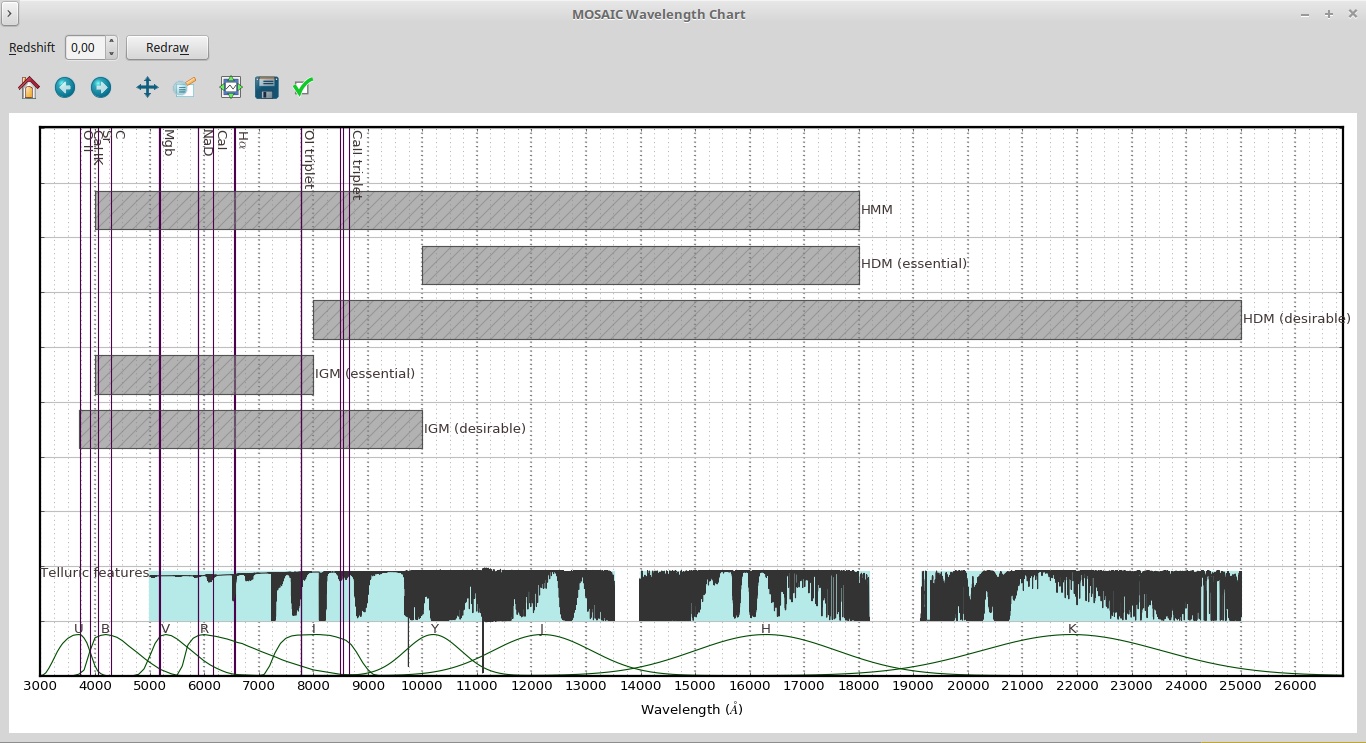
Figure – Lines with zero redshift
This application creates a chart stacking the MOSAIC spectrograph wavelength coverages and
an ESO Earth atmospheric model. This may serve either as a reference to MOSAIC wavelength invervals for each
mode (on this, see also list-mosaic-modes.py) or to verify the Earth atmospheric emission/trasmission
in a wavelength region of observational interest.
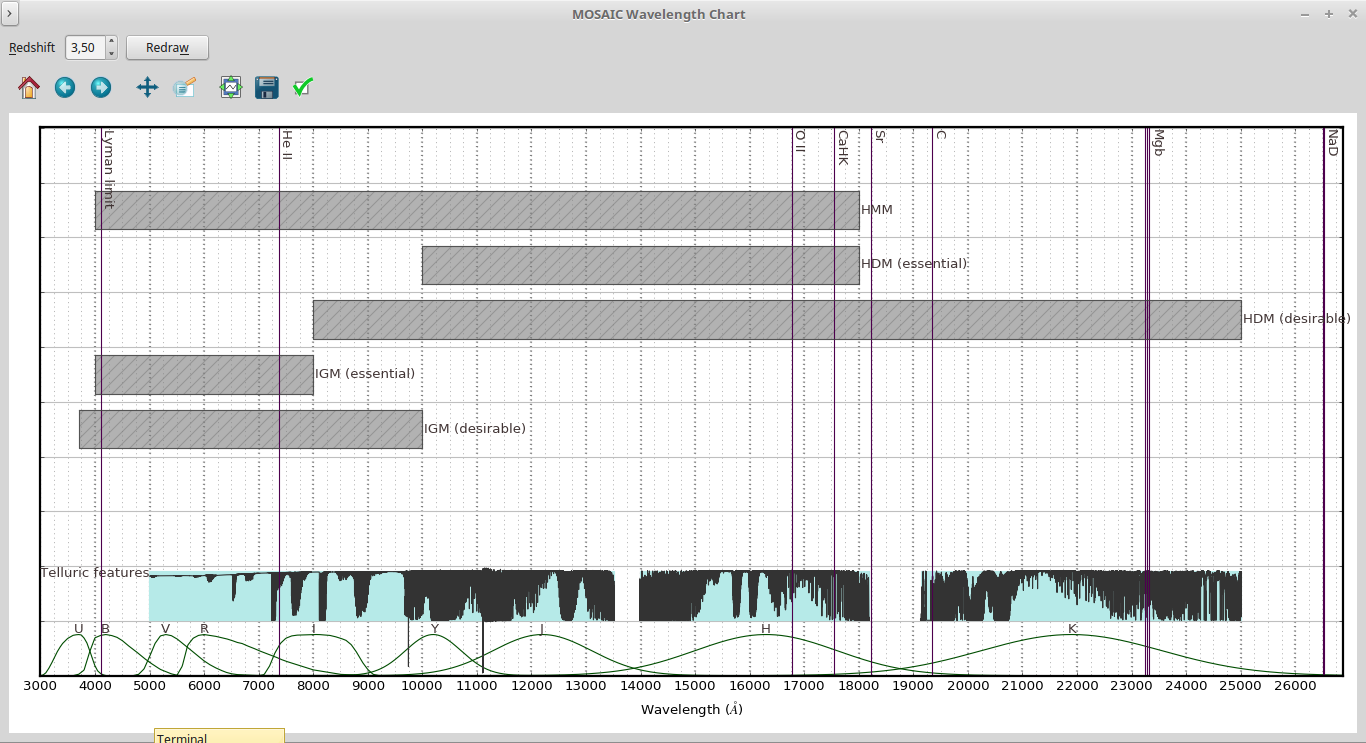
It is also possible to inform a redshift so that the chemical lines will be accordingly displaced:

Figure – z=3.5